

In today’s data-driven business landscape, startups need powerful analytics to compete with larger organizations—but without the enterprise-level price tags! According to a recent CB Insights report, 70% of startups that effectively leverage business intelligence tools experience higher growth rates in their first three years. The right BI solution can transform raw data into actionable insights, helping your startup make smarter decisions faster. But with hundreds of options available, how do you choose the perfect business intelligence tool that balances functionality, scalability, and affordability? So, join me as we dive deeper into these extensive topics and try to leverage which tools can help us elevate our business startups to unforeseen heights never reached before, thanks to these innovative tools in 2025!
Understanding Business Intelligence Tools for Startups
Based on expert findings, business intelligence (BI) tools are essential software applications that transform raw business data into actionable insights, helping startups make informed decisions when resources are limited. Many founders initially make the mistake of adopting complex enterprise-level solutions like Tableau or Power BI, which require technical expertise and significant investment, instead of choosing more startup-friendly alternatives like Grow, Databox, or smaller Looker packages. When selecting a BI tool, the key considerations should be easy data integration with existing systems, customizable dashboards accessible to non-technical team members, and automated reporting features that deliver insights efficiently.
There are signs that your startup is ready for a dedicated BI platform, including when spreadsheets become unwieldy for tracking metrics (typically around 15 employees and 50 regular customers), when departments report conflicting numbers that undermine decision-making confidence, or when stakeholders begin requiring more sophisticated reporting for meetings. Most founders recognize in hindsight that they should have implemented proper BI tools earlier, as the transition from cobbled-together reporting systems to structured data analysis can prevent growth slowdowns caused by data chaos. Investing in appropriate business intelligence tools at the right time creates immediate value through clearer visibility into company performance, helping startups effectively utilize their funding and demonstrate traction to investors.
In conclusion, startup-focused BI solutions are designed specifically for organizations without dedicated data teams, offering more intuitive interfaces, faster implementation, and budget-friendly pricing compared to their enterprise counterparts. The primary value of these tools lies in their ability to connect disparate data sources, making it possible to generate comprehensive insights without extensive technical knowledge or weeks of integration work. So for growing startups, the ideal time to adopt BI tools is often six months before they feel necessary, preventing the scenario where founders spend excessive time preparing reports instead of focusing on strategic growth opportunities.
Key Features to Look for in Startup BI Tools
Selecting appropriate business intelligence tools for startups requires focusing on practical features rather than flashy capabilities. Data integration is the most critical consideration, with successful entrepreneurs emphasizing the importance of pre-built connectors like HubSpot, Mailchimp, or Pipedrive that seamlessly work with your existing tech stack. Popular startup-friendly options such as Domo, Grow, and Databox promote numerous integrations, but a thorough investigation of compatibility with your specific services can prevent months of custom development work.
Effective visualization and collaboration features directly determine whether teams will actually use the BI tool or abandon it entirely. User-friendly interfaces with drag-and-drop functionality and diverse chart options prove essential for startups without dedicated analysts to create meaningful visualizations. The ability to share dashboards, add comments, and control access permissions becomes increasingly valuable as companies grow, particularly during investor meetings when immediate data sharing can significantly enhance credibility.
Furthermore, startup founders should carefully evaluate pricing structures and implementation timelines to avoid unexpected costs and delays. Many BI solutions appear affordable initially but become expensive as companies scale, with pricing models based on data sources, users, or data volume creating surprising increases as business needs evolve. Prioritizing transparent pricing aligned with your growth trajectory, avoiding early long-term commitments, and realistically assessing implementation timeframes can prevent losing valuable months waiting for your BI solution to become fully operational.
Key Points:
• Data integration is the most critical feature for startup BI tools, with pre-built connectors to existing services preventing months of custom development work.
• Visualization and collaboration features determine adoption success – user-friendly interfaces with drag-and-drop functionality are essential for teams without dedicated analysts.
• Transparent pricing aligned with growth trajectory is crucial, as many BI solutions that appear affordable initially become expensive when scaling based on data sources, users, or volume.
Top Free and Open-Source BI Tools for Early-Stage Startups
Current trends exemplify that cash-strapped startups can leverage powerful free and open-source business intelligence tools that offer impressive capabilities despite costing nothing. Metabase stands out as a user-friendly option with intuitive interfaces that allow even non-technical team members to create reports quickly while providing clean visualizations suitable for investor presentations. Other notable alternatives include Apache Superset (originally built for Facebook’s internal analytics), Redash (ideal for SQL-savvy teams), and Google Data Studio (now Looker Studio in its free version), each offering unique strengths depending on a startup’s specific technical expertise and data sources.
While these free options deliver significant value, they come with important trade-offs that founders should consider before implementation. All require some technical setup rather than being truly “plug and play” like paid alternatives, potentially demanding Docker experience and database knowledge from your team. Limited support options, less sophisticated security features, and occasional maintenance challenges can create stressful situations, as one founder discovered when their Redash instance stopped working before an important investor meeting.
1. Metabase
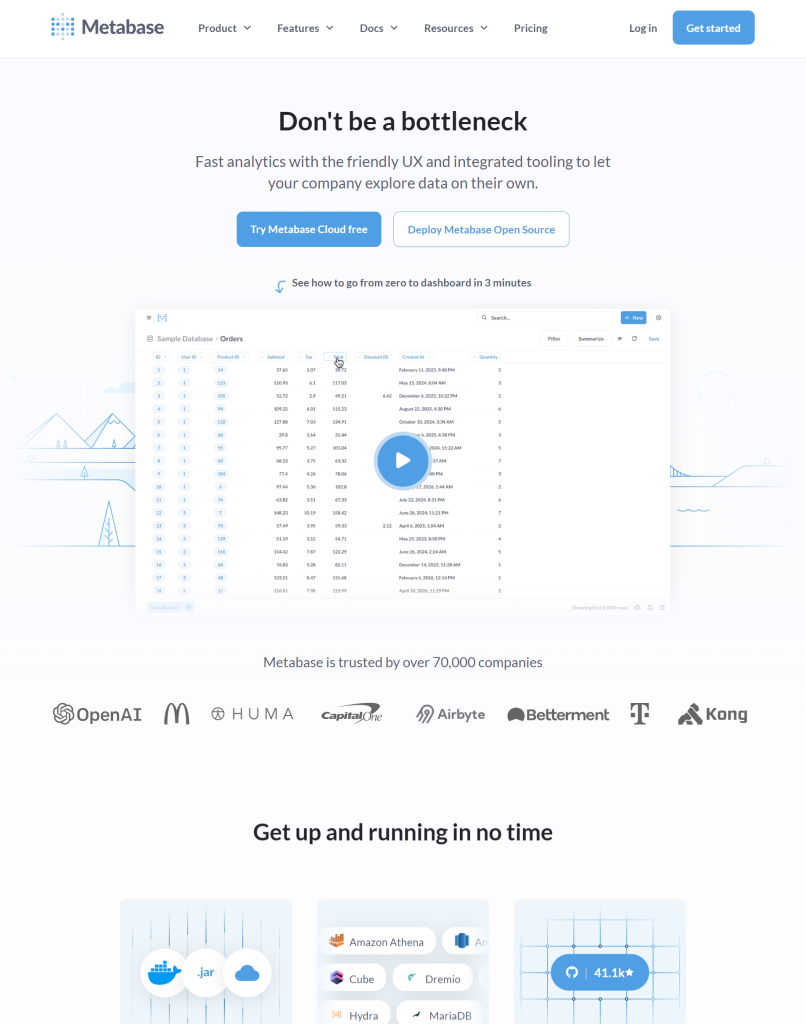
An intelligence layer built into the Metabase analytics platform that enables users to ask questions about their data in natural language without writing SQL code. It simplifies data analysis by automatically generating visualizations, providing smart recommendations, and helping users discover insights through conversational queries that translate into accurate database queries.
2. Apache Superset
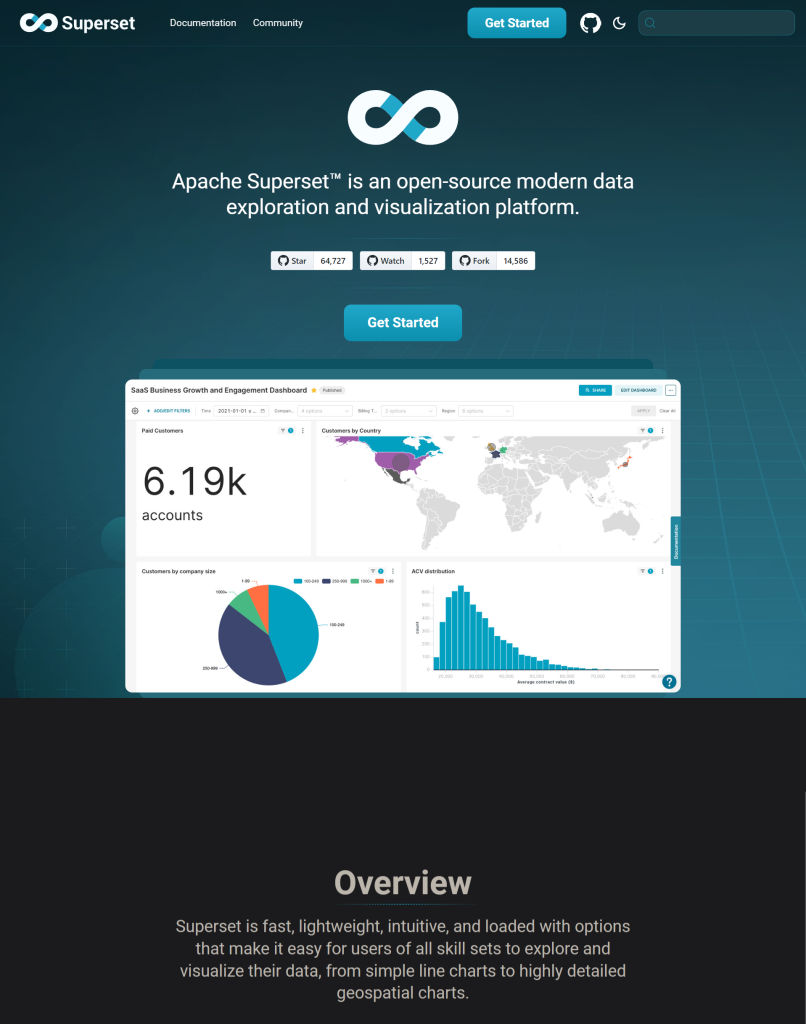
An AI tool that enhances the open-source data visualization and exploration platform by integrating natural language processing capabilities that allow users to generate charts and dashboards through conversational queries. It empowers business users to perform complex analytics without SQL knowledge while providing AI-powered insights, anomaly detection, and predictive features that help organizations extract maximum value from their data assets.
3. Redash
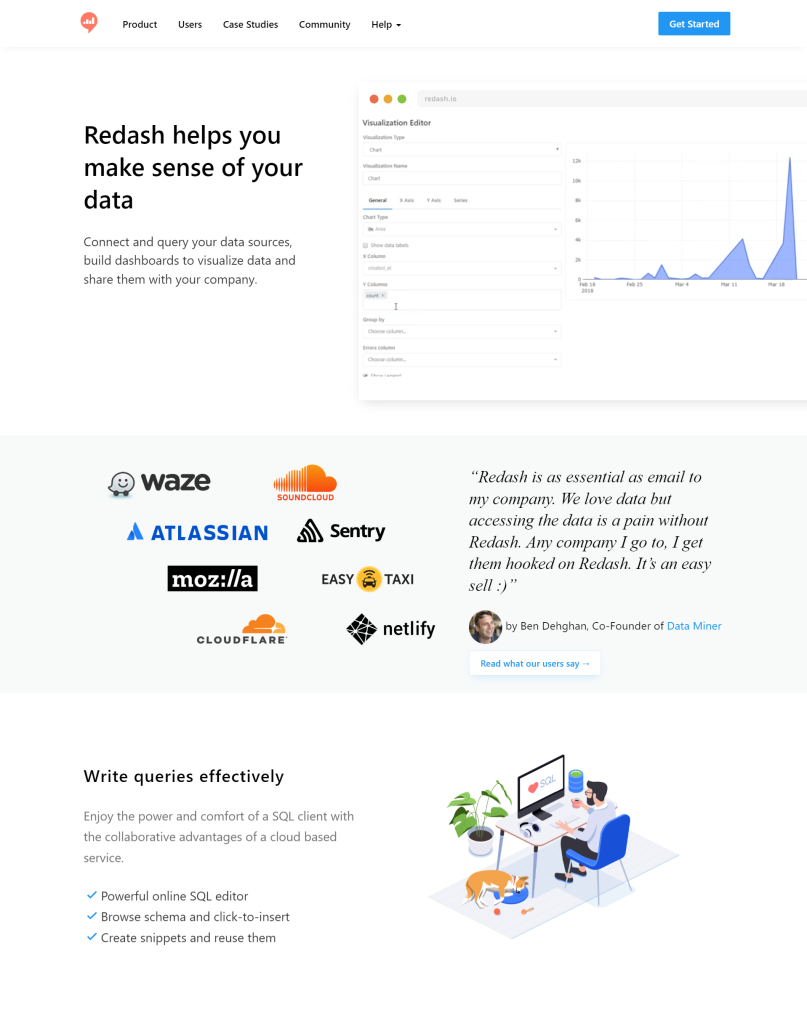
An intelligent enhancement to the Redash data visualization platform that allows users to interact with their data through natural language queries instead of writing complex SQL. It streamlines the analytics process by automatically generating appropriate visualizations, suggesting relevant metrics, and enabling business users to extract meaningful insights from their data without requiring deep technical expertise.
4. Google Data Studio

An AI tool that enhances the data visualization platform by incorporating intelligent features that automatically suggest relevant charts, generate insights, and allow users to create reports through natural language commands. It simplifies the reporting process by using machine learning to identify patterns, predict trends, and transform complex datasets into accessible visualizations that help businesses make data-driven decisions without requiring extensive technical expertise.
In conclusion, many startups find success by starting with free tools and upgrading strategically as their needs evolve and resources increase. Metabase Cloud, starting around $85/month, becomes reasonable once you factor in developer maintenance time, while commercial offerings for tools like Superset provide enterprise features while maintaining compatibility with existing setups. The most important consideration isn’t feature lists but actual adoption—a simpler solution embraced by your team delivers more value than a powerful platform that remains unused due to complexity.
Best Affordable Paid BI Tools Under $500/Month
Startups with limited budgets can find powerful business intelligence solutions in the $250-500 monthly range that deliver significant value without consuming excessive resources. Grow.com offers a comprehensive platform with an intuitive interface designed specifically for startups, allowing even non-technical team members to create complex visualizations quickly while providing robust integration with common tools like Stripe, HubSpot, and Google Analytics. Other strong contenders include Databox, which excels in marketing analytics and features valuable goal-tracking capabilities that can help identify concerning trends before they become critical, and Zoho Analytics, which provides near enterprise-grade analytical capabilities, including predictive analytics and cohort analysis features.
5. Zoho
An intelligent assistant integrated across Zoho’s suite of business applications that helps users automate routine tasks, analyze data, and generate insights. It enables businesses to enhance productivity through features like smart email categorization, predictive sales forecasting, anomaly detection in finances, and natural language queries for simplified data analysis.
6. Grow
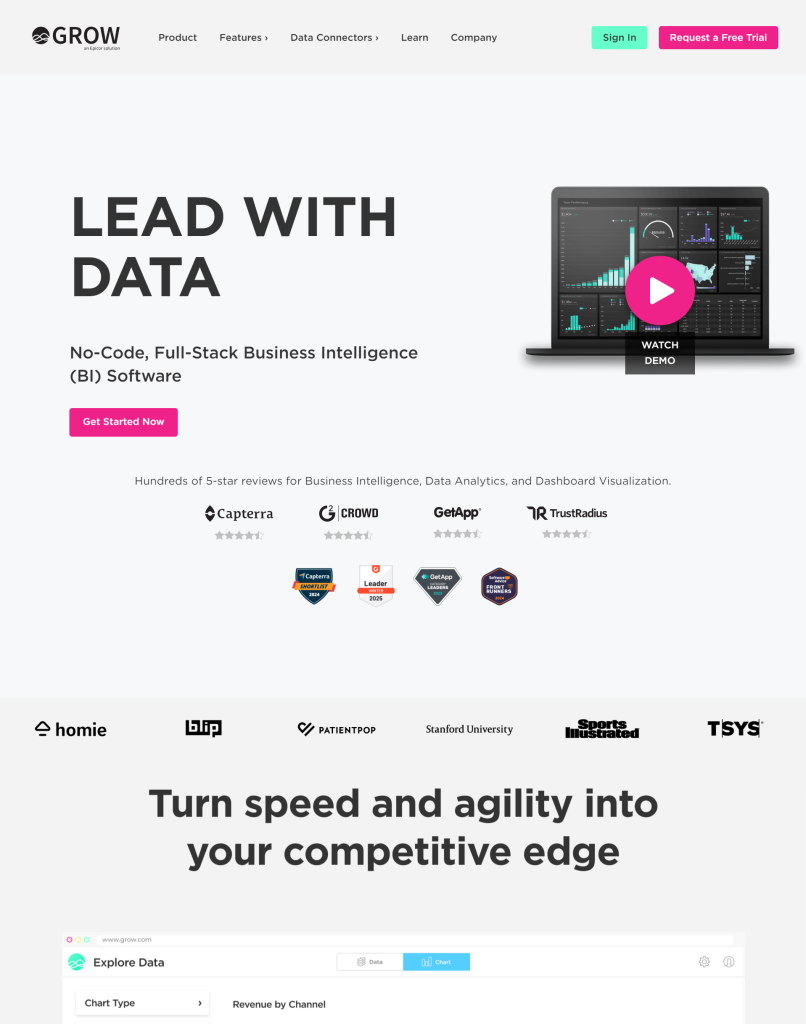
A business intelligence platform that leverages artificial intelligence to transform raw business data into actionable insights through automated data analysis and intuitive visualizations. The tool enables companies of all sizes to make data-driven decisions by automatically identifying trends, anomalies, and opportunities across multiple data sources without requiring advanced technical expertise.
7. Databox
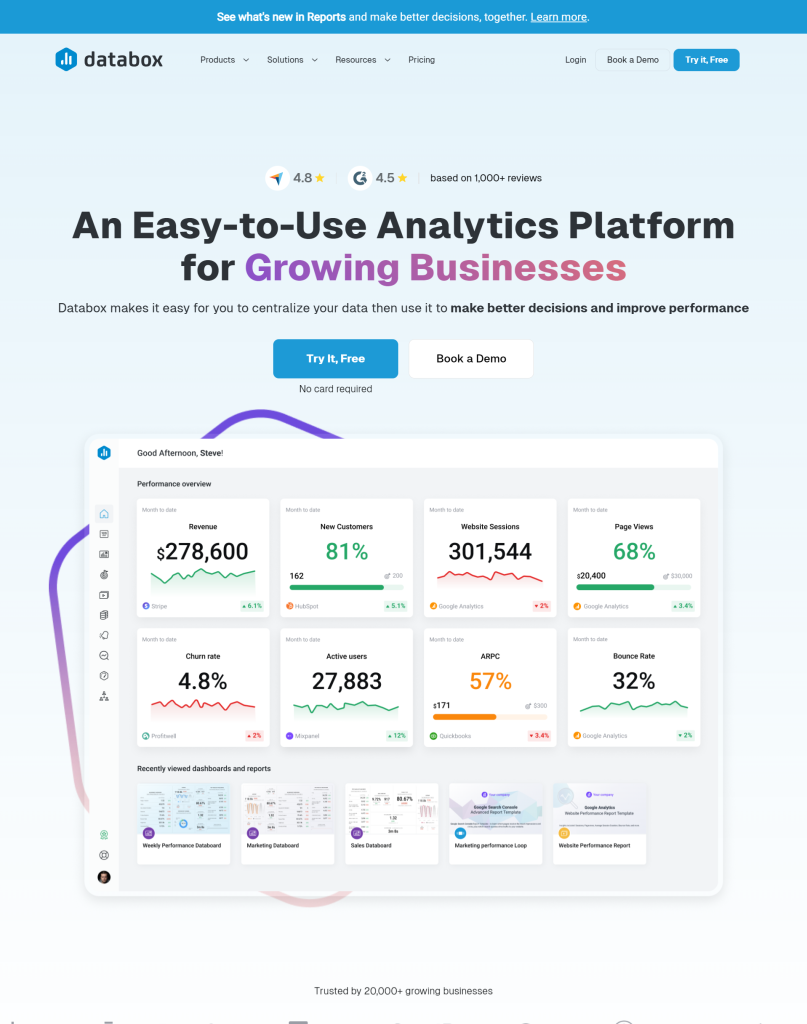
An intelligent analytics platform that automatically aggregates data from multiple business sources and generates actionable insights through natural language processing and machine learning algorithms. It enables companies to track performance metrics in real time, receive personalized recommendations, and create automated reports with AI-powered predictions that help teams make more informed business decisions without requiring technical expertise.
When evaluating mid-tier BI solutions, startups should carefully consider pricing structures that typically combine factors like user seats, data connectors, and data volume in various ways. Grow charges primarily by dashboard and data source with unlimited users. Databox uses a user-based model with caps on databoards and connections, while Zoho scales based on both users and data rows, making it essential to calculate total costs based on current needs plus projected growth over at least 12 months. The quality and depth of integrations vary significantly between platforms, with some providing comprehensive access to metrics while others deliver only basic data, requiring a thorough evaluation of how each solution connects with your specific tech stack.
User-friendliness and support quality dramatically impact the successful implementation of BI tools in startup environments where time and technical resources are often limited. Databox ranks highest for non-technical accessibility with its Apple-like simplicity, followed closely by Grow, which balances ease of use with analytical flexibility, while Zoho offers powerful capabilities but requires more analytical thinking to be used effectively. There are reports that dedicated onboarding specialists and responsive support teams are crucial when issues arise, making it essential to evaluate not just feature lists but the overall experience and adoption potential across your organization.
Enterprise-Grade BI Tools with Startup-Friendly Plans
Several enterprise-grade business intelligence platforms offer special programs for startups that provide powerful capabilities at significantly reduced costs. Looker (now part of Google Cloud) delivers a valuable data modeling layer that creates a consistent way for everyone in a company to access and interpret data, helping resolve cross-department disagreements about metric calculations. Other notable options include Tableau, which offers their “Tableau for Startups” program for venture-backed companies under five years old, and Microsoft’s Power BI, which provides most enterprise capabilities for about $20 per user monthly through their Premium Per User plan, with additional benefits potentially available through the Microsoft for Startups program.
While these startup programs offer tremendous value, they come with important limitations and eligibility requirements that founders should carefully consider before committing. Most programs restrict eligibility to companies under five years old, below certain revenue thresholds, and often require venture backing, potentially excluding bootstrapped startups. Feature limitations vary by platform—Looker restricts the number of models and queries, Tableau caps user seats and data storage, and Power BI limits refresh rates and some advanced features—while the transition to regular pricing after the 1-2 year program period can represent a dramatic cost increase from a few hundred to several thousand dollars monthly.
Despite these considerations, startups have achieved remarkable results by leveraging enterprise-grade analytics tools for specific high-value use cases when they have the technical capabilities to utilize them effectively. One SaaS company used Tableau’s advanced cohort analysis to identify specific churn patterns, leading to a targeted fix that improved retention by 34% and helped secure Series B funding. For many companies, investing in enterprise-grade tools with startup pricing makes sense only once they have dedicated data personnel and clearly defined analytical needs that simpler tools cannot address, making it essential to test the full enterprise version before committing and to develop a transition strategy for when startup pricing ends.
Industry-Specific BI Tools for Different Startup Sectors
Startups in specialized industries benefit significantly from using business intelligence tools designed specifically for their sector rather than generic platforms. E-commerce companies can leverage solutions like Glew.io, which comes pre-configured with retail-specific metrics such as customer lifetime value, product affinity, and inventory forecasting while automatically segmenting customers into actionable cohorts based on purchasing behavior. Other sectors have equally valuable specialized options—SaaS startups can use ChartMogul or ProfitWell (now Paddle) for subscription analytics, marketplace businesses benefit from Amplitude or Mixpanel’s dual-sided platform metrics, fintech companies require regulatory-compliant environments like Domino Data Lab, and healthcare organizations need HIPAA-compliant solutions such as Health Catalyst or Arcadia.io.
The specialized capabilities of industry-specific BI tools provide contextual insights that generic platforms simply cannot match, delivering immediate value through features designed for particular business models. SaaS-focused tools track critical metrics like monthly recurring revenue, churn rates, and customer acquisition cost payback periods out of the box while handling complex subscription billing calculations that general BI systems struggle with. Similarly, marketplace analytics platforms excel at measuring matching efficiency, liquidity by category, and cross-side network effects, enabling companies to identify critical patterns—such as one platform discovering that suppliers who completed profiles within 48 hours were three times more likely to remain active long-term.
While specialized BI solutions typically cost more than general-purpose alternatives and may offer less flexibility for businesses with hybrid models, their targeted insights can dramatically accelerate growth within established industry verticals. For early-stage startups still finding product-market fit or operating across multiple sectors, general BI tools might be more appropriate initially, but companies with clear industry focus should consider specialized solutions based on recommendations from other founders in their specific sector. The right industry-specific tool provides not just better data but the right contextual information with relevant benchmarks, helping startups identify opportunities that might otherwise remain hidden behind generic metrics.
No-Code BI Solutions for Non-Technical Founders
Modern no-code business intelligence platforms have revolutionized data analysis for founders without technical backgrounds, making complex insights accessible without requiring SQL knowledge or data science expertise. Tools like Toucan Toco, GoodData, Domo, Grow.com, and Cluvio feature intuitive visual interfaces that allow users to connect multiple data sources—such as Stripe, Mailchimp, and Google Analytics—within minutes rather than days or weeks. Their drag-and-drop report-building capabilities enable founders to create custom dashboards quickly, with one entrepreneur discovering that their highest-value customers were coming from a marketing channel they had been planning to cut—an insight that paid for the BI tool subscription many times over.
Pre-built template libraries represent one of the most valuable features of no-code BI solutions, providing educational frameworks that help founders understand which metrics matter most for their specific business model. Platforms like Databox offer extensive galleries of ready-made templates for various sectors, including SaaS, e-commerce, and marketing, saving valuable time while simultaneously teaching users about relevant performance indicators they might have overlooked. Learning curves vary between platforms—with Databox and Toucan Toco requiring perhaps 2-3 hours to become comfortable, while more powerful tools like Domo or GoodData might demand a full day of focused effort before producing useful dashboards.
The quality of support resources and innovative features like natural language querying can significantly impact the success of implementation for non-technical users. Some platforms offer dedicated onboarding specialists and responsive support channels, while others provide minimal guidance through sparse knowledge bases or delayed email responses. Advanced functionality, such as ThoughtSpot’s ability to generate visualizations from typed questions like “What was our conversion rate last month compared to this month?” proves invaluable during investor meetings and quick decision-making scenarios. These accessible tools have effectively democratized data analysis, enabling founders to make truly data-driven decisions without specialized technical skills or dedicated analytics staff.
Implementing Business Intelligence in Your Startup
The successful business intelligence implementation begins with clearly defining the specific business questions you need to answer rather than rushing to create fancy dashboards. Many founders make the critical mistake of skipping this essential first step, along with neglecting to audit and clean their data sources, which often contain duplicate entries, inconsistent tagging, and significant information gaps. Starting small with a single dashboard that addresses your three most pressing business questions builds confidence in the system and provides quick wins, while attempting to track every conceivable metric simultaneously typically results in dashboards that quickly become outdated and unused.
Proper data governance, including maintaining a simple dictionary that defines each metric’s calculation method, prevents the common problem of different teams reporting conflicting numbers due to inconsistent definitions. Training must extend beyond the analytics team to include all end users who need to make decisions based on the data, with identified champions in each department demonstrating actual business decisions made using the new system. Realistic implementation timelines for most startups span 3-5 months from initial needs assessment through adoption—including 2-4 weeks for requirements definition, 2-3 weeks for tool selection, 2-4 weeks for initial setup, and another 4-8 weeks for training and integration into regular workflows.
Despite these challenges, properly implemented BI solutions deliver transformative results for growing companies when tied directly to operational processes and meeting structures. One founder reported marketing spend efficiency improvements of 34% in the first quarter after full adoption, along with the identification of a customer segment with triple the lifetime value of their average user. Accepting that data will never be perfect while being transparent about its limitations allows companies to start generating valuable insights immediately, improving data quality incrementally while documenting the entire implementation process to build institutional knowledge for future iterations as the startup grows.
Key Points:
• Start with clearly defined business questions and clean data sources before rushing to create dashboards – focus on a single dashboard addressing your three most pressing issues rather than tracking every metric.
• Establish proper data governance with a metric dictionary to prevent conflicting reports and ensure training extends beyond the analytics team to all end users with department champions demonstrating real business decisions.
• Realistic BI implementation timelines for startups span 3-5 months, but properly implemented solutions can deliver significant results like 34% marketing spend efficiency improvements when tied to operational processes.
Measuring ROI from Your Business Intelligence Investment
Measuring the true value of business intelligence investments requires focusing on business outcomes rather than simple usage metrics like dashboard views or active users. Key performance indicators that demonstrate actual impact include “time to insight” (how quickly teams can answer critical business questions), “decision confidence ratings” (surveying decision-makers about their confidence levels with and without BI insights), and data quality improvements (reduction in reporting errors and cross-departmental discrepancies). One company reduced the time needed to calculate customer acquisition costs from three days to instant access, saving approximately 36 person-days annually, worth $27,000 in reclaimed productive time, while their average decision confidence scores jumped from 6.2/10 to 8.7/10 within six months of implementation.
Concrete cost savings from BI implementations often extend beyond time efficiency to include consolidation of redundant software subscriptions, reduction in reporting errors, and measurable improvements in departmental effectiveness. One organization eliminated nearly $34,000 in annual overlapping analytics tool subscriptions, reduced their finance team’s monthly reporting time from 40 hours to just 5 hours, and decreased major reporting errors from 14 to just 2 in six months. Marketing teams leveraging proper conversion attribution dashboards saw average cost per acquisition drop by 23% (saving $62,000), while product teams improved feature development efficiency by 44%, reducing development cycles for successful features from 3.2 to 1.8.
While some BI benefits materialize quickly through efficiency gains, the most substantial returns typically require 6-12 months to fully develop as they stem from improved strategic decision-making rather than tactical improvements. Companies defining specific, measurable use cases before implementation achieve faster ROI than those who implement technology without clear applications, with full investment recovery typically taking 12-14 months rather than the 8-10 months often promised by vendors. Beyond the obvious metrics, the true value of business intelligence comes from improved decision quality, opportunity identification, and targeted strategies like pricing optimization—one company increased average revenue per user by 18% without impacting conversion rates by using BI insights to develop premium pricing tiers for specific customer segments.
Future Trends in Startup Business Intelligence
Artificial intelligence integration in business intelligence tools has transformed from an enterprise-only luxury to an accessible capability for startups at reasonable price points. Products like AI and Akkio now offer predictive modeling and natural language processing capabilities for less than $300 monthly, allowing non-technical users to generate instant visualizations by simply typing questions like “Show me customer churn by region compared to last quarter.” Modern predictive analytics tools have become increasingly effective with smaller datasets, enabling startups with just a few thousand customers to forecast behavior with surprising accuracy—one company reduced churn by 23% by identifying at-risk customers before they showed obvious signs of leaving.
Mobile-first business intelligence platforms are gaining significant traction as startup teams frequently need to access metrics between meetings, while commuting, or outside traditional work hours. Companies like Databox and GoodData are designing their experiences primarily for mobile devices before scaling to desktop, recognizing that the ability to receive alerts, check key performance indicators, and share insights from smartphones has become essential for modern startup operations. This shift represents a valuable lesson for advisors who previously recommended desktop-focused platforms only to discover that teams rarely used them due to their on-the-go work styles.
To conclude, embedded analytics has emerged as a particularly valuable trend for product-focused startups, creating new revenue streams and enhancing user experiences by integrating insights directly into their platforms. The tools for building these embedded experiences have dramatically improved, with platforms like Sisense and Looker streamlining the process and reducing the technical resources required for implementation. Business intelligence capabilities that were once considered optional luxuries have become fundamental requirements for startup success, with experienced advisors observing that companies lacking proper analytics often struggle to adapt to changing market conditions that data-driven insights would have identified.
Conclusion
Selecting the right business intelligence tool is a critical decision that can dramatically accelerate your startup’s growth trajectory. The solutions highlighted in this guide offer the perfect balance of functionality, affordability, and scalability that startups need. Remember that the ideal BI tool isn’t necessarily the one with the most features—it’s the one that aligns with your specific data needs, team capabilities, and growth stage. Start with a solution that meets your immediate requirements but can scale as your data complexity increases. By implementing one of these recommended business intelligence tools, your startup will be well-positioned to make data-driven decisions that drive competitive advantage and sustainable growth. So, don’t wait any longer and begin taking advantage of these technologies now!